

Short answer: An Indian business selling to global buyers keeps only about two-thirds of what its customers intended to pay. The loss is not one big failure. It is six or seven small leaks that multiply. The Realisation Ratio is a way to model all of them at once: acceptance capacity times commerce intelligence, divided by accumulated friction.
TL;DR
- The Realisation Ratio measures how much buyer intent becomes usable revenue: It combines acceptance capacity and commerce intelligence, then accounts for friction across checkout, approvals, fraud, chargebacks, FX, fees, settlement, and compliance.
- Cross-border revenue leaks compound rather than add: Small losses at each stage can reduce ₹100 crore of buyer intent to roughly ₹64 crore on a generic stack, while a corridor-native setup can retain materially more.
- Indian exporters should optimise the full chain, not one metric: Track checkout completion, authorisation by country, fraud, chargebacks, FX cost, FIRA timing, and EDPMS ageing together to identify where revenue is actually disappearing.
The number nobody puts on a slide
Every exporter and global seller tracks GMV. Most track conversion. Some track authorisation rates. Almost nobody tracks the full chain from a buyer's intent to pay all the way through to money sitting in an Indian bank account with a compliance document attached to it.
That chain is where the money goes.
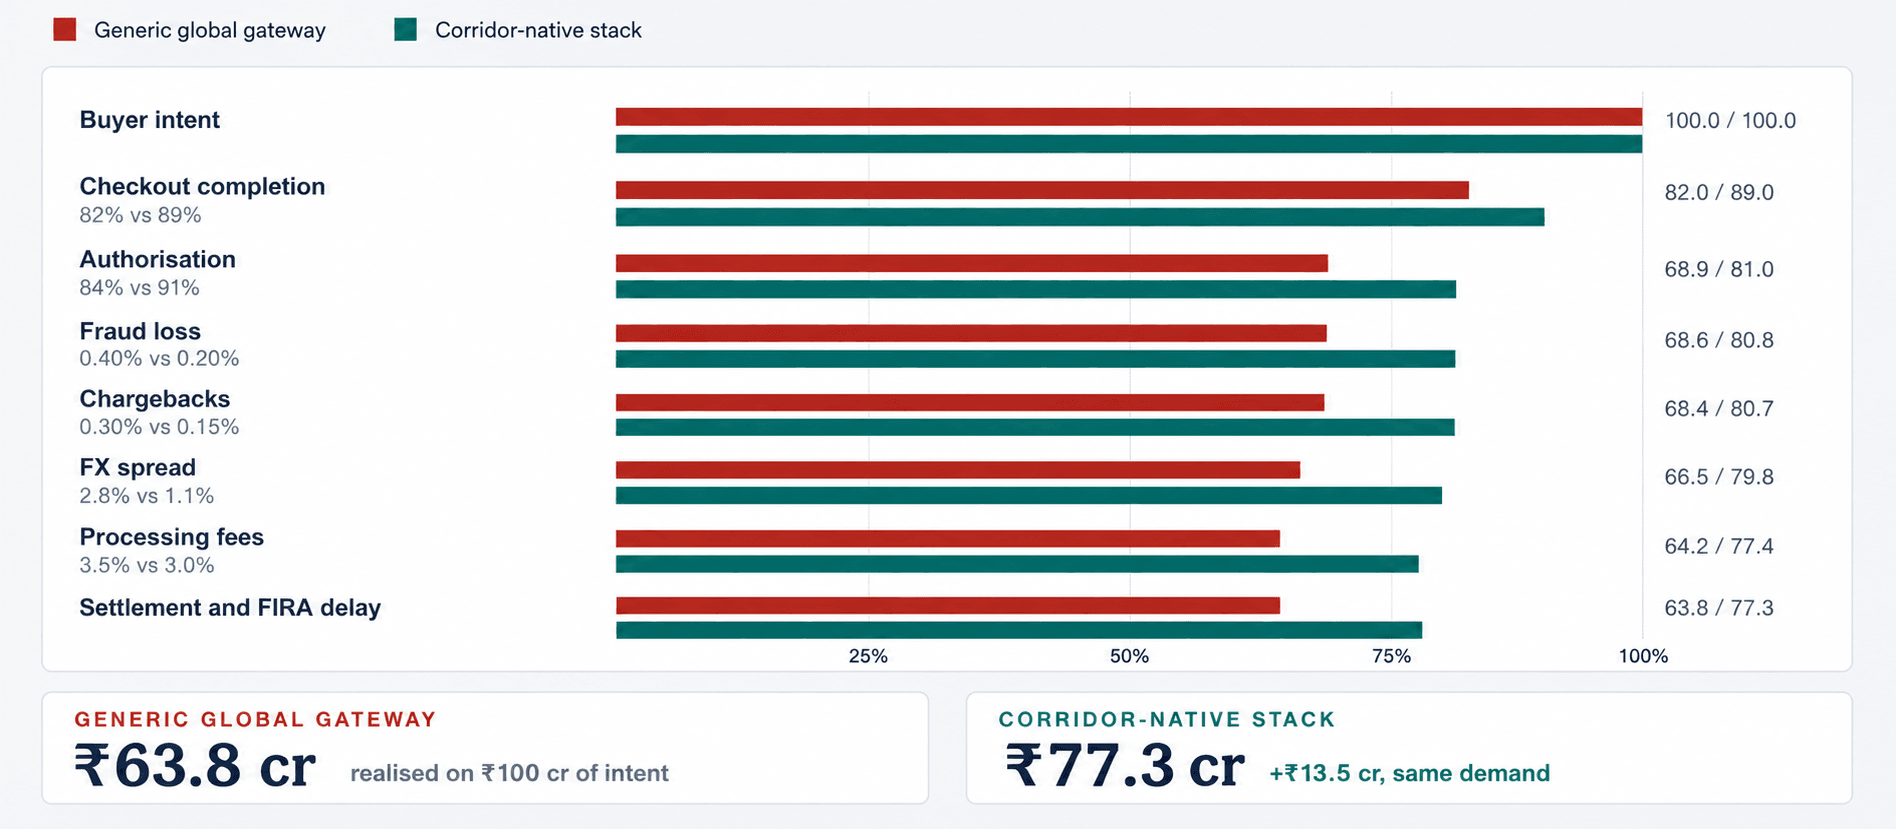
An Indian SaaS company or D2C exporter billing ₹100 crore a year to overseas buyers does not receive ₹100 crore. It typically realises somewhere in the low sixties. Not because of pricing. Not because of demand. Because value leaks at every handoff in between.
Realised revenue is multiplicative, not additive
This is the part that surprises finance teams. Leaks do not add up. They compound.

Work it through with an illustrative profile for an Indian exporter on a generic global gateway:
| Stage | Rate | Cumulative retained |
|---|---|---|
| Buyer intent | 100% | 100.0% |
| Checkout completion | 82% | 82.0% |
| Authorisation | 84% | 68.9% |
| Fraud loss | 0.40% | 68.6% |
| Chargebacks | 0.30% | 68.4% |
| FX spread | 2.8% | 66.5% |
| Processing fees | 3.5% | 64.2% |
| Settlement and documentation delay | 0.6% | 63.8% |
Now run the same volume through a corridor-native stack: local acquiring in the buyer's market, dynamic routing, network tokens, tighter FX, and same-day FIRA.
| Stage | Rate | Cumulative retained |
|---|---|---|
| Checkout completion | 89% | 89.0% |
| Authorisation | 91% | 81.0% |
| Fraud loss | 0.20% | 80.8% |
| Chargebacks | 0.15% | 80.7% |
| FX spread | 1.1% | 79.8% |
| Processing fees | 3.0% | 77.4% |
| Settlement and documentation delay | 0.15% | 77.3% |
Same product. Same customers. Same marketing spend. ₹13.5 crore difference.
That is the entire argument, and it is why the ratio is worth formalising.
The leakage chain
Cumulative share of buyer intent that survives to realised rupees. Illustrative profile, ₹100 crore of annual export commerce.
The Realisation Ratio
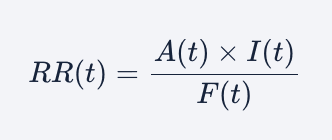
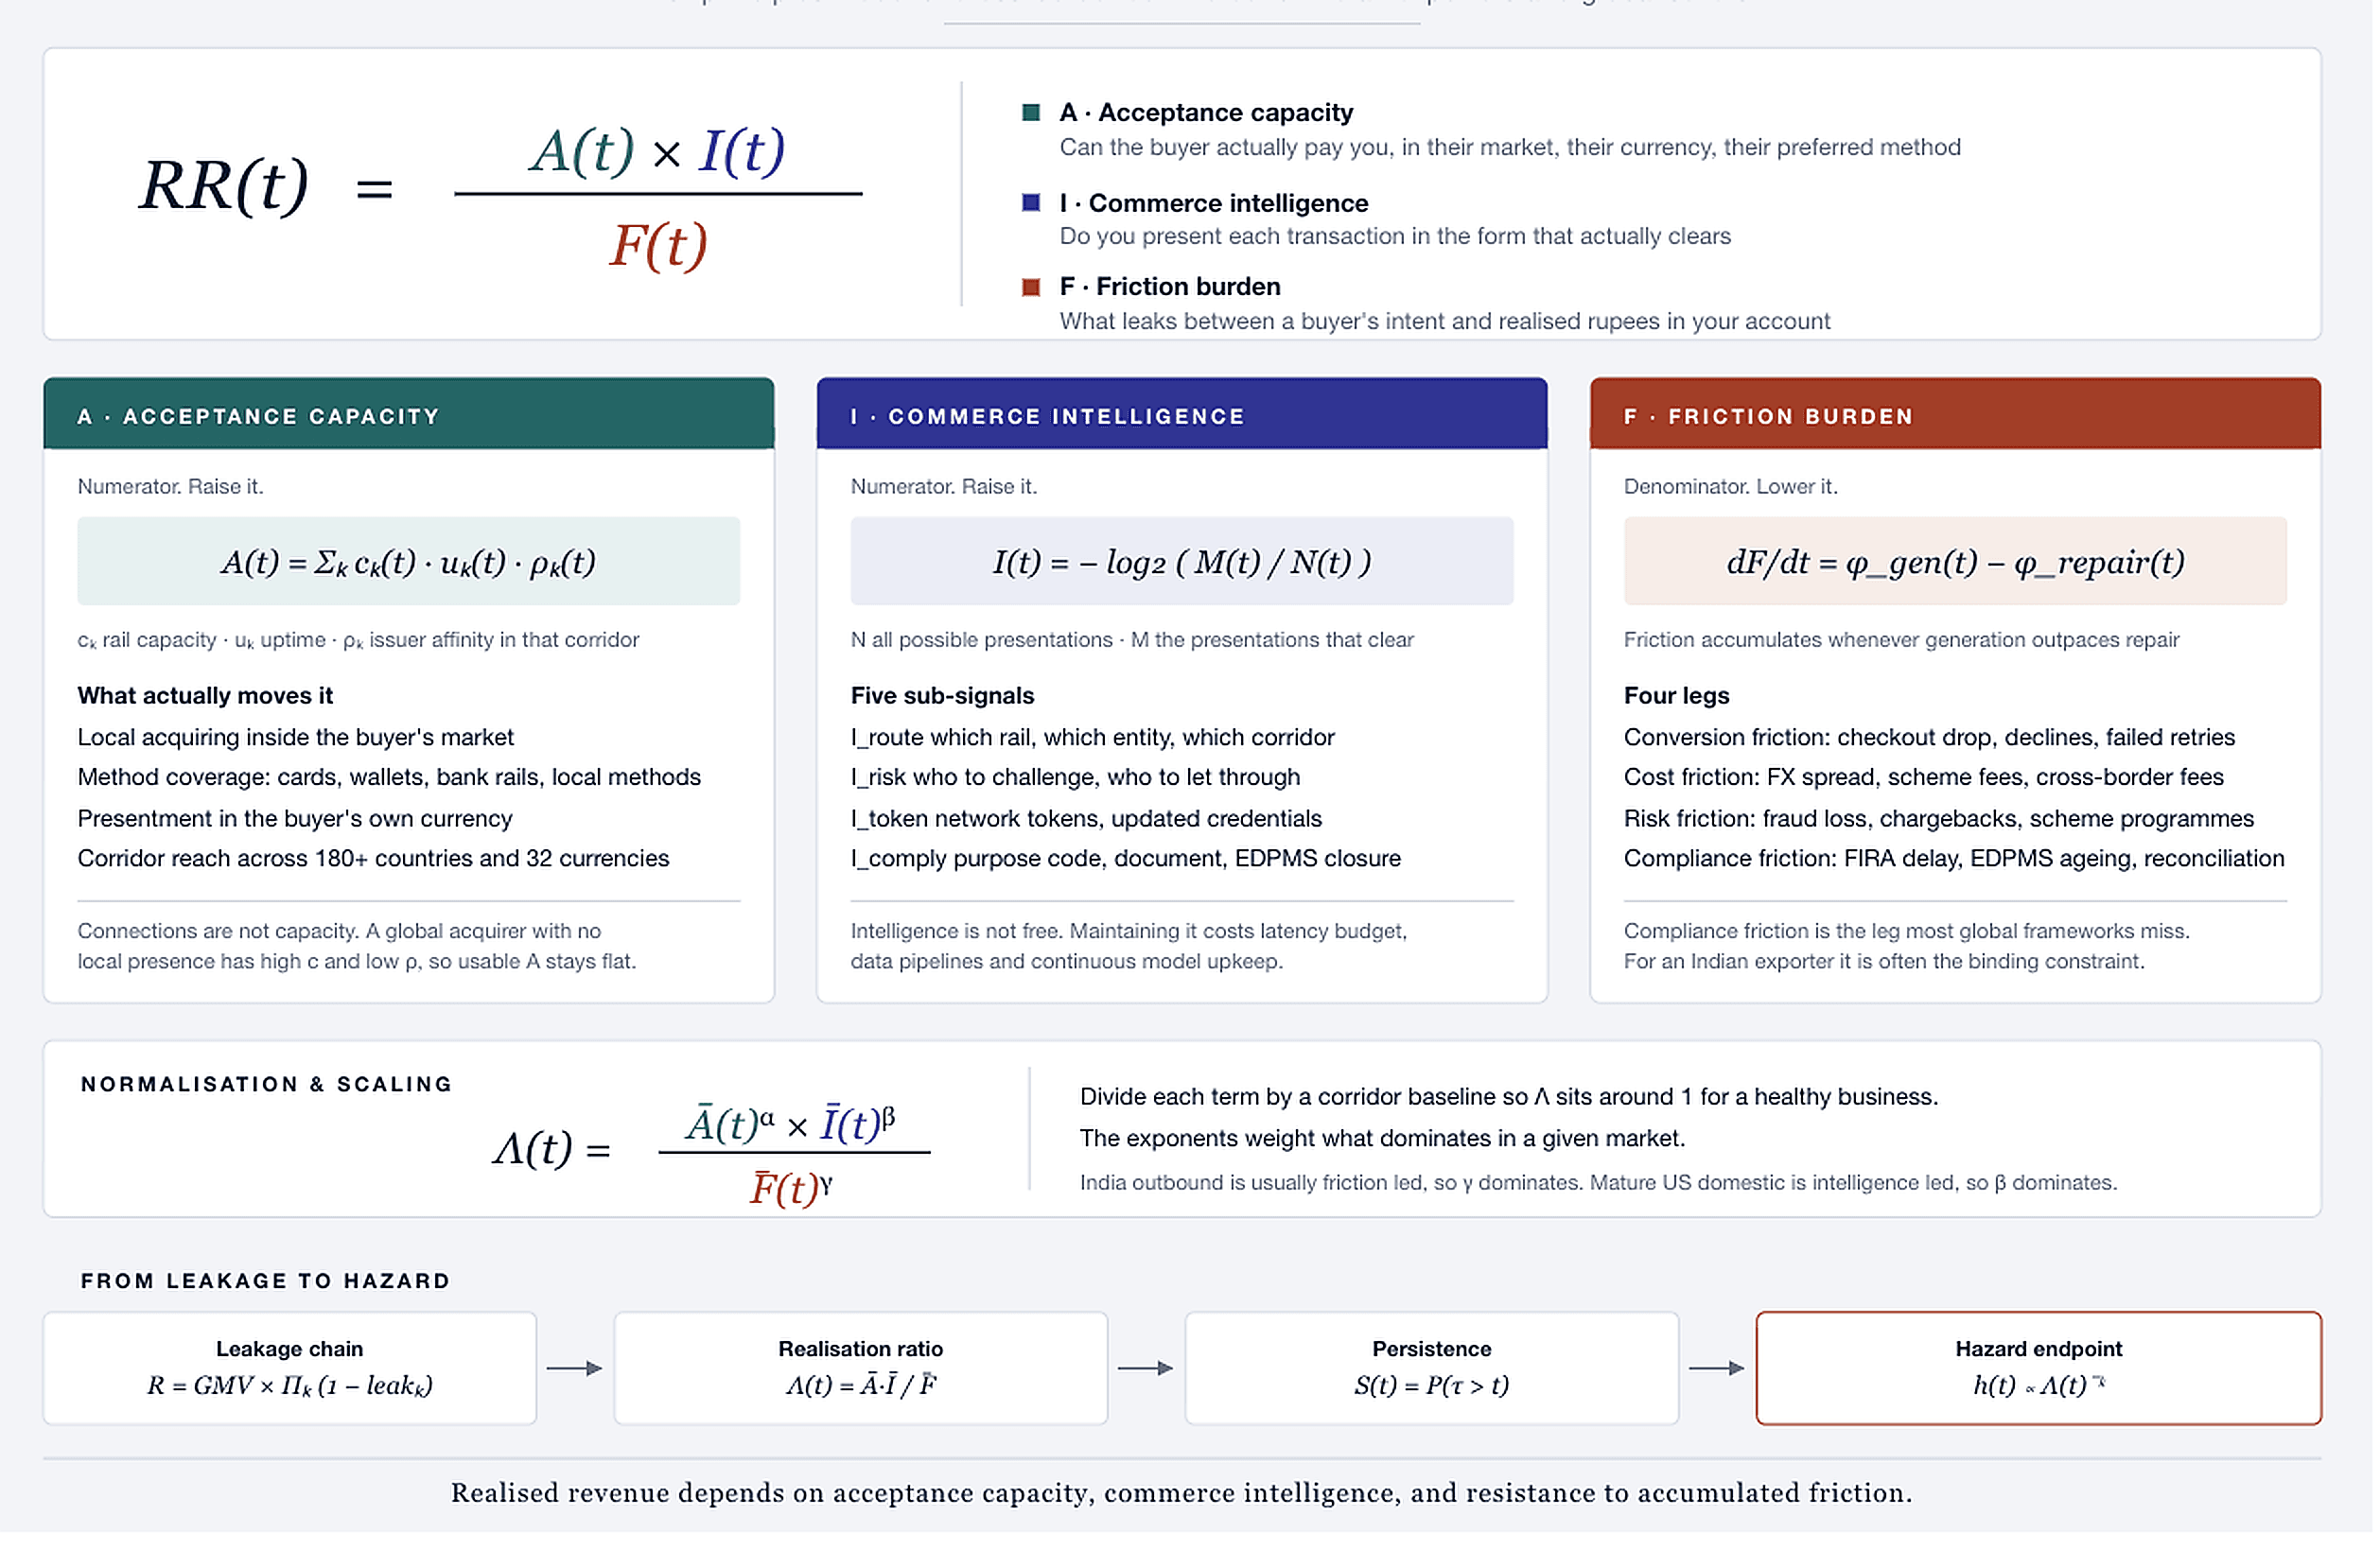
Three forces decide how much of a buyer's intent you actually keep.
| Term | What it means |
|---|---|
| A Acceptance capacity | Can the buyer actually pay you, in their market, their currency, their preferred method |
| I Commerce intelligence | Do you present each transaction in the form that actually clears |
| F Friction burden | What leaks between intent and realised rupees |
Two of these you raise. One you lower. Everything a payments team does maps onto one of the three.
A. Acceptance capacity
Acceptance is not the number of logos on your integrations page.
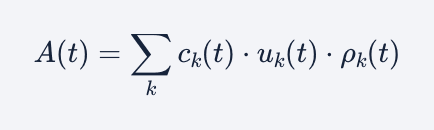
For each rail k: c is raw capacity, u is uptime, ρ is issuer affinity inside that corridor. A large global acquirer processing your Germany traffic from a non-EU entity has high c and low ρ. The connection exists. The approvals do not follow.
What actually moves acceptance capacity:
- Local acquiring inside the buyer's market. A German card presented to a German acquirer behaves like a domestic transaction. The same card presented cross-border carries higher decline risk, higher interchange, and often a foreign transaction fee that the buyer sees and resents.
- Method coverage. Cards are not universal. iDEAL in the Netherlands, PIX in Brazil, SEPA in the EU, ACH in the US. If a buyer's default method is missing, acceptance capacity for that buyer is zero regardless of how good your card stack is.
- Currency presentment. Showing a Dutch buyer a price in USD is a conversion tax you pay in drop-off, before any payment even attempts.
- Corridor reach. Coverage across 180+ countries and 32 currencies only counts where the local rail is actually live.
The rule: connections are not capacity. Ask your provider for approval rate by issuing country, not blended approval rate. Blended numbers hide dead corridors.
B. Commerce intelligence
For any single transaction there are dozens of ways it could be presented. Which acquiring entity. Which currency. Which MCC. Whether to invoke 3D Secure. Whether to use a network token or a raw PAN. When to retry a soft decline, and how.
Only a narrow subset of those combinations gets approved. Intelligence is knowing which subset, per transaction, in real time.
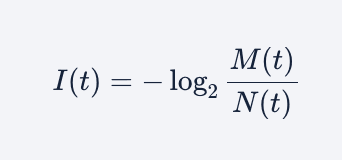
Where N is every possible presentation and M is the set that actually clears. The narrower M is relative to N, the more information you need to hit it, and the more valuable your routing layer becomes.
It decomposes into five signals:
| Signal | What it decides |
|---|---|
| Routing | Which rail, which entity, which corridor |
| Risk | Who to challenge, who to let through, where to step up |
| Token | Network tokens and account updater to survive card reissuance |
| Retry | Which declines are worth retrying, and on what schedule |
| Compliance | Correct purpose code, correct document, clean EDPMS closure |
There is a real cost here, and it is worth being honest about it. Maintaining commerce intelligence is not free. It consumes latency budget, data pipelines, and continuous model retraining. A routing engine that was tuned two years ago is a liability, because issuer behaviour drifts.
C. Friction burden
Friction is the denominator, and it is the term most teams underestimate because it accumulates quietly.
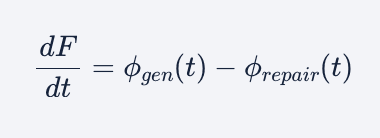
Friction is generated continuously by corridor fragmentation, regulatory divergence, scheme rule changes and fraud adaptation. It is repaired by tuning, reconciliation and remediation. When generation outpaces repair, the ratio decays. Nobody notices at the transaction level. Everyone notices at quarter close.
Four legs:
- Conversion friction. Checkout abandonment, hard declines, failed retries, forced redirects.
- Cost friction. FX spread, cross-border assessment fees, scheme fees, the markup you never see itemised.
- Risk friction. Fraud loss, chargebacks, and the operating cost of scheme monitoring programmes such as VAMP.
- Compliance friction. Delayed FIRA or FIRC issuance, ageing EDPMS entries, purpose code errors, manual reconciliation against bank statements.
The leg most frameworks miss
Global payments literature models the first three legs well. It ignores the fourth almost entirely, because it does not exist outside India in this form.
For an Indian exporter, compliance friction is frequently the binding constraint. Money can land in your account and still not be usable, because your auditor will not recognise it, your EDPMS entry is open, or your FIRA has not been issued. Working capital sits frozen behind a document.
This is why a global gateway with a beautiful checkout can still leave an Indian exporter worse off than a corridor-native provider with slightly higher headline pricing. The headline rate is one leak out of seven.
Normalisation: making the ratio comparable
Raw A, I and F are not comparable across businesses. Normalise each against a corridor baseline so a healthy business sits near 1, then weight the terms:
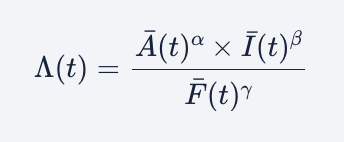
The exponents encode which lever actually matters in your market:
- India outbound is friction led. γ dominates. Compliance and FX drag are usually worth more than another point of routing sophistication.
- Mature US domestic is intelligence led. β dominates. Acceptance is largely solved, so the edge is in risk and routing precision.
- A new corridor is acceptance led. α dominates. Nothing else matters until the local rail is live.
Knowing which exponent dominates is the difference between a payments roadmap that compounds and one that optimises the wrong thing for a year.
From ratio to hazard: why decay is not linear
A falling Realisation Ratio does not produce a proportional revenue dip. It produces an accelerating one.
Define persistence as the probability that a merchant is still viably operating in a corridor at time t:
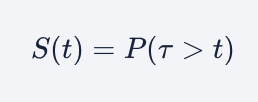
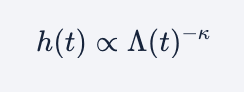
The hazard, meaning the instantaneous risk of corridor exit or merchant churn, scales inversely:
In practice this is what a slow ratio decline looks like from the inside:
- Approval rates slip two points. Nobody escalates.
- Support load rises. Buyers report failed payments that "worked last month".
- Chargeback ratio drifts toward scheme thresholds.
- Finance widens the FX assumption in the model to explain the gap.
- The corridor is quietly deprioritised in the next planning cycle.
By step five the business has concluded that a market does not work, when what actually happened is that its ratio decayed. This is the most expensive misdiagnosis in cross-border commerce.
How to measure your own ratio this quarter
You do not need the full formalism to act on it. Pull seven numbers.
| # | Metric | Where to get it | Warning sign |
|---|---|---|---|
| 1 | Checkout completion by country | Analytics, not gateway | Any market more than 8 points below your best |
| 2 | Authorisation rate by issuing country | Gateway, unblended | Any corridor below 85% |
| 3 | Fraud loss as % of volume | Risk reports | Rising quarter on quarter |
| 4 | Chargeback ratio by scheme | Scheme reporting | Approaching programme thresholds |
| 5 | All-in FX cost vs mid-market | Compare settlement to interbank rate on the same date | Above 1.5% |
| 6 | Days to FIRA issuance | Your provider | More than 1 day |
| 7 | Open EDPMS entries older than 90 days | Your AD bank | Any non-zero number that is growing |
Multiply the retention rates together. That number, expressed as a percentage of intent, is your Realisation Ratio in its simplest form. Track it monthly. It is a better health metric than any single one of its inputs.
Why we built PayGlocal around the denominator
Most cross-border providers optimise the numerator, because acceptance and intelligence are visible, demoable and easy to sell.
We built for the denominator, because that is where Indian exporters actually lose money. Cross-border-first architecture, local acquiring, dynamic routing, and compliance automation that closes the loop from authorisation through to FIRA and EDPMS, inside one system rather than three vendors and a spreadsheet.
The ratio is the reason the architecture looks the way it does.